
What does Rantt do?
Rantt provides a simple to use and information rich environment
for exploring and understanding time stamped data.
Who is Rantt for?
Anyone that works with or needs to understand time stamped data.
This includes but is not limited to
- Managers
- Schedulers
- Planners
- Consultants
- Researchers
Disciplines that will find Rantt useful
- Planning
- Scheduling
- Simulation
- Event based modelling
- Optimisation
Why is there a need for Rantt?
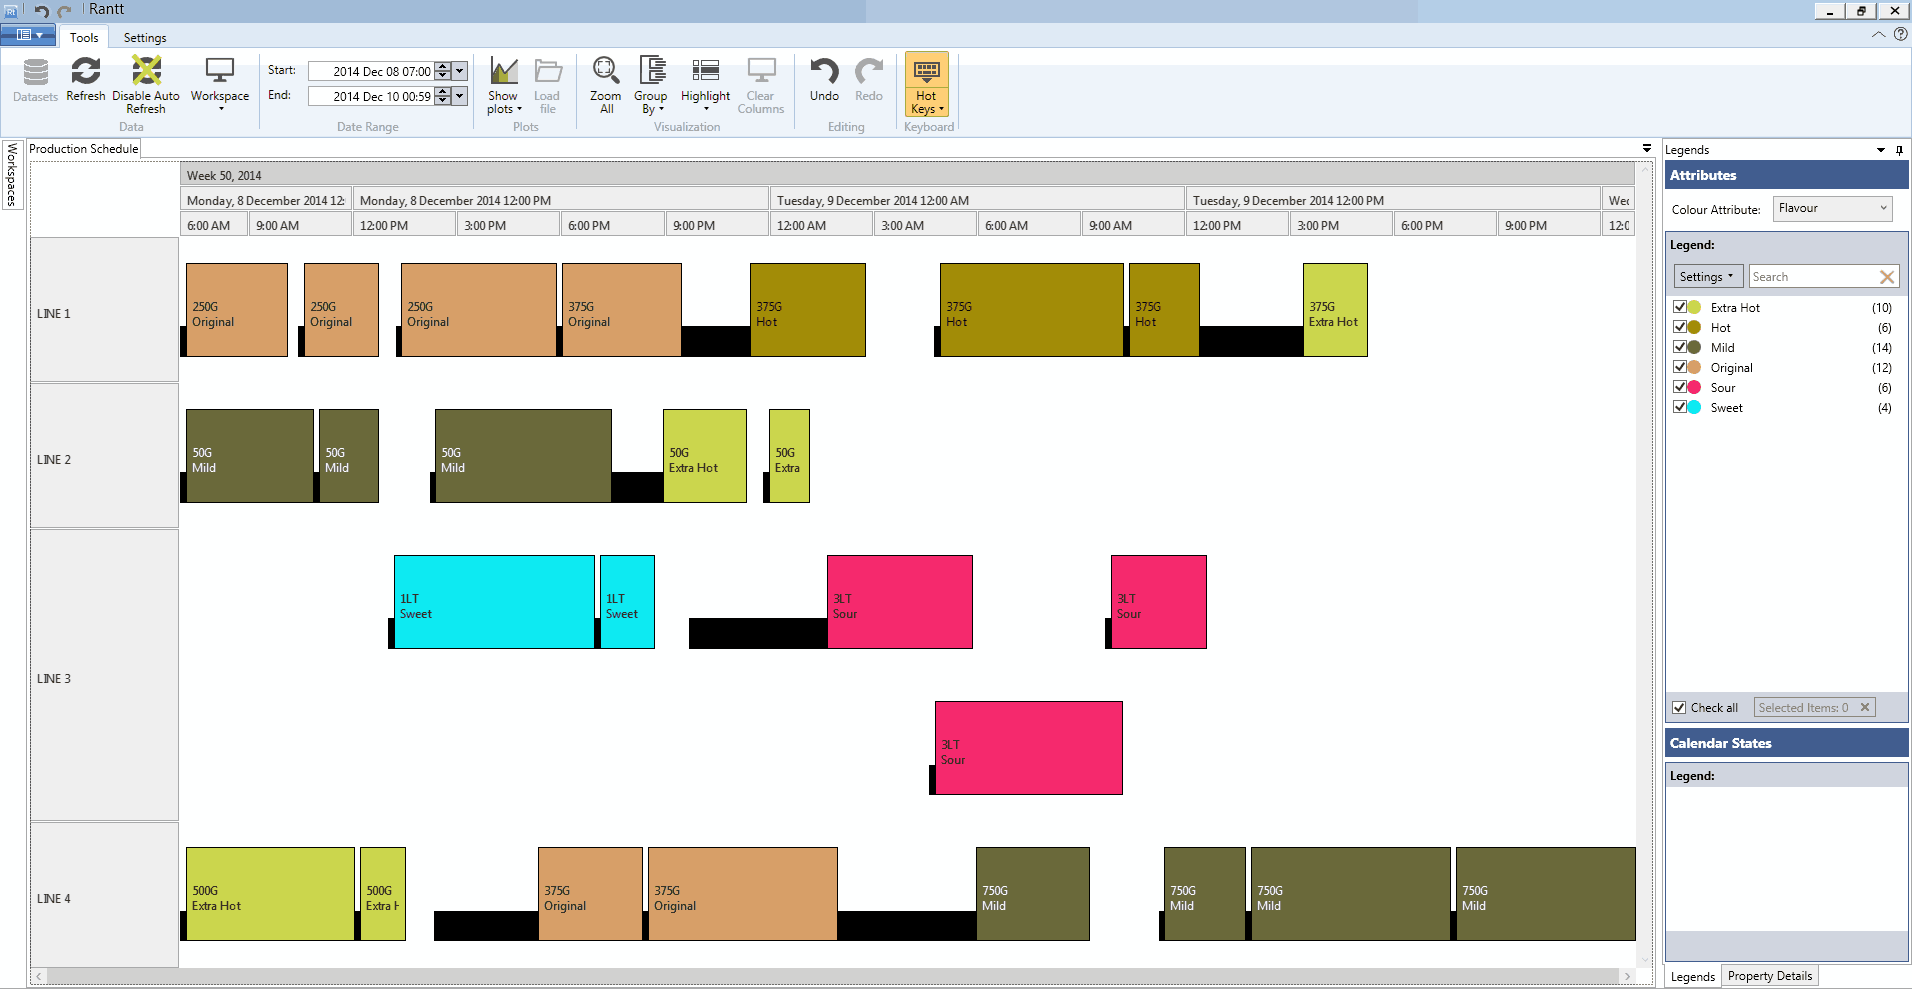
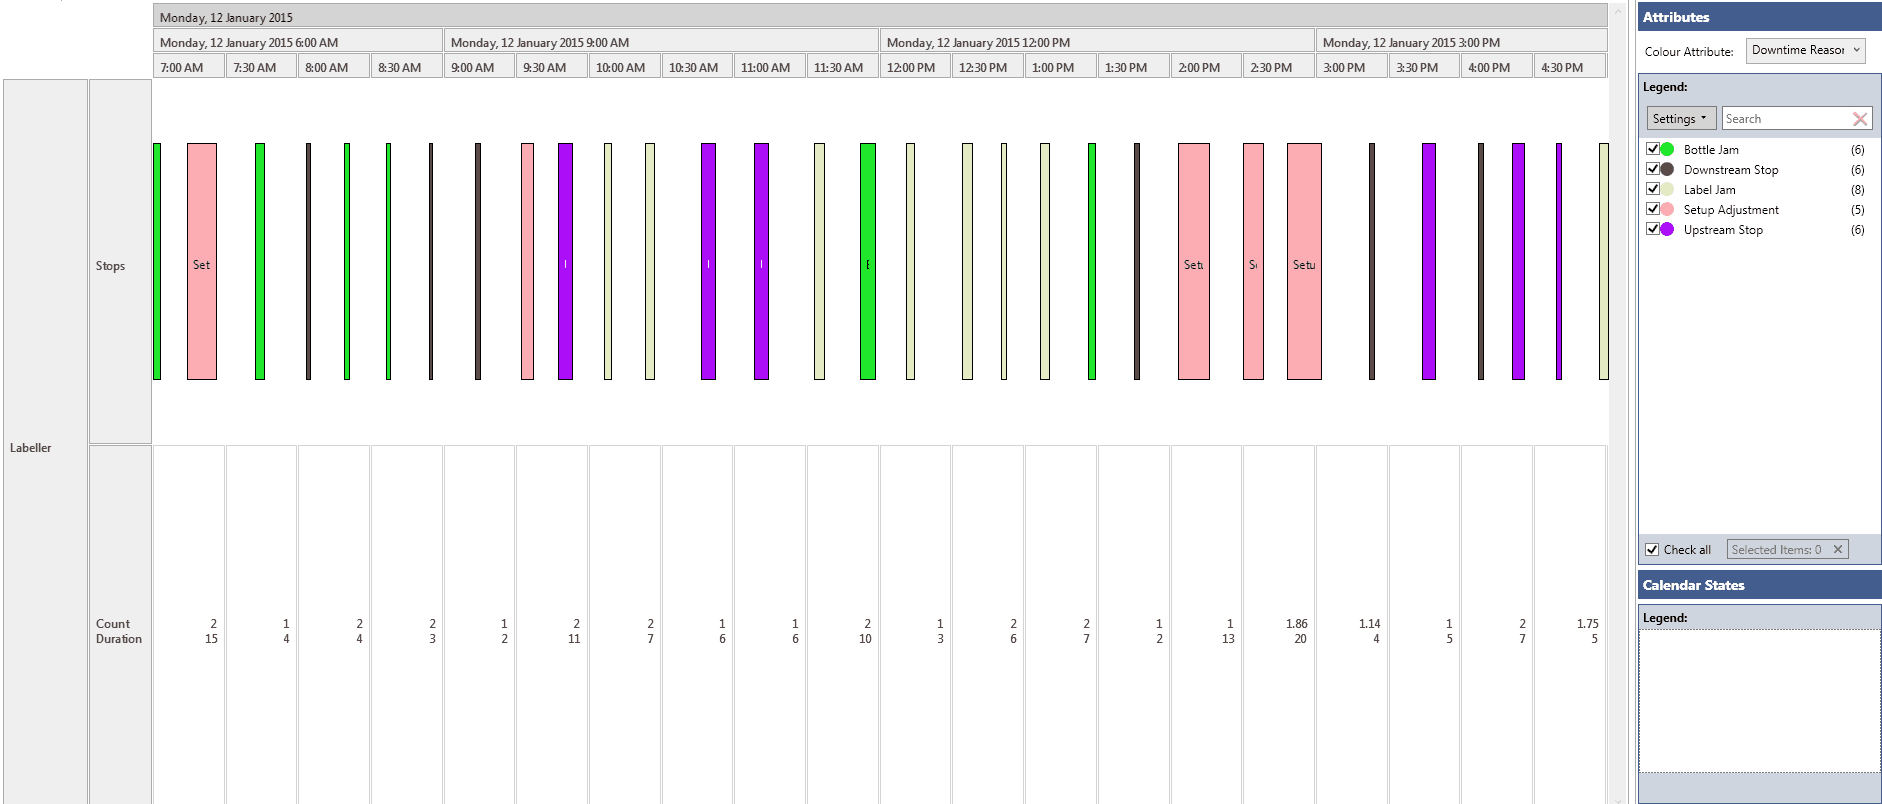
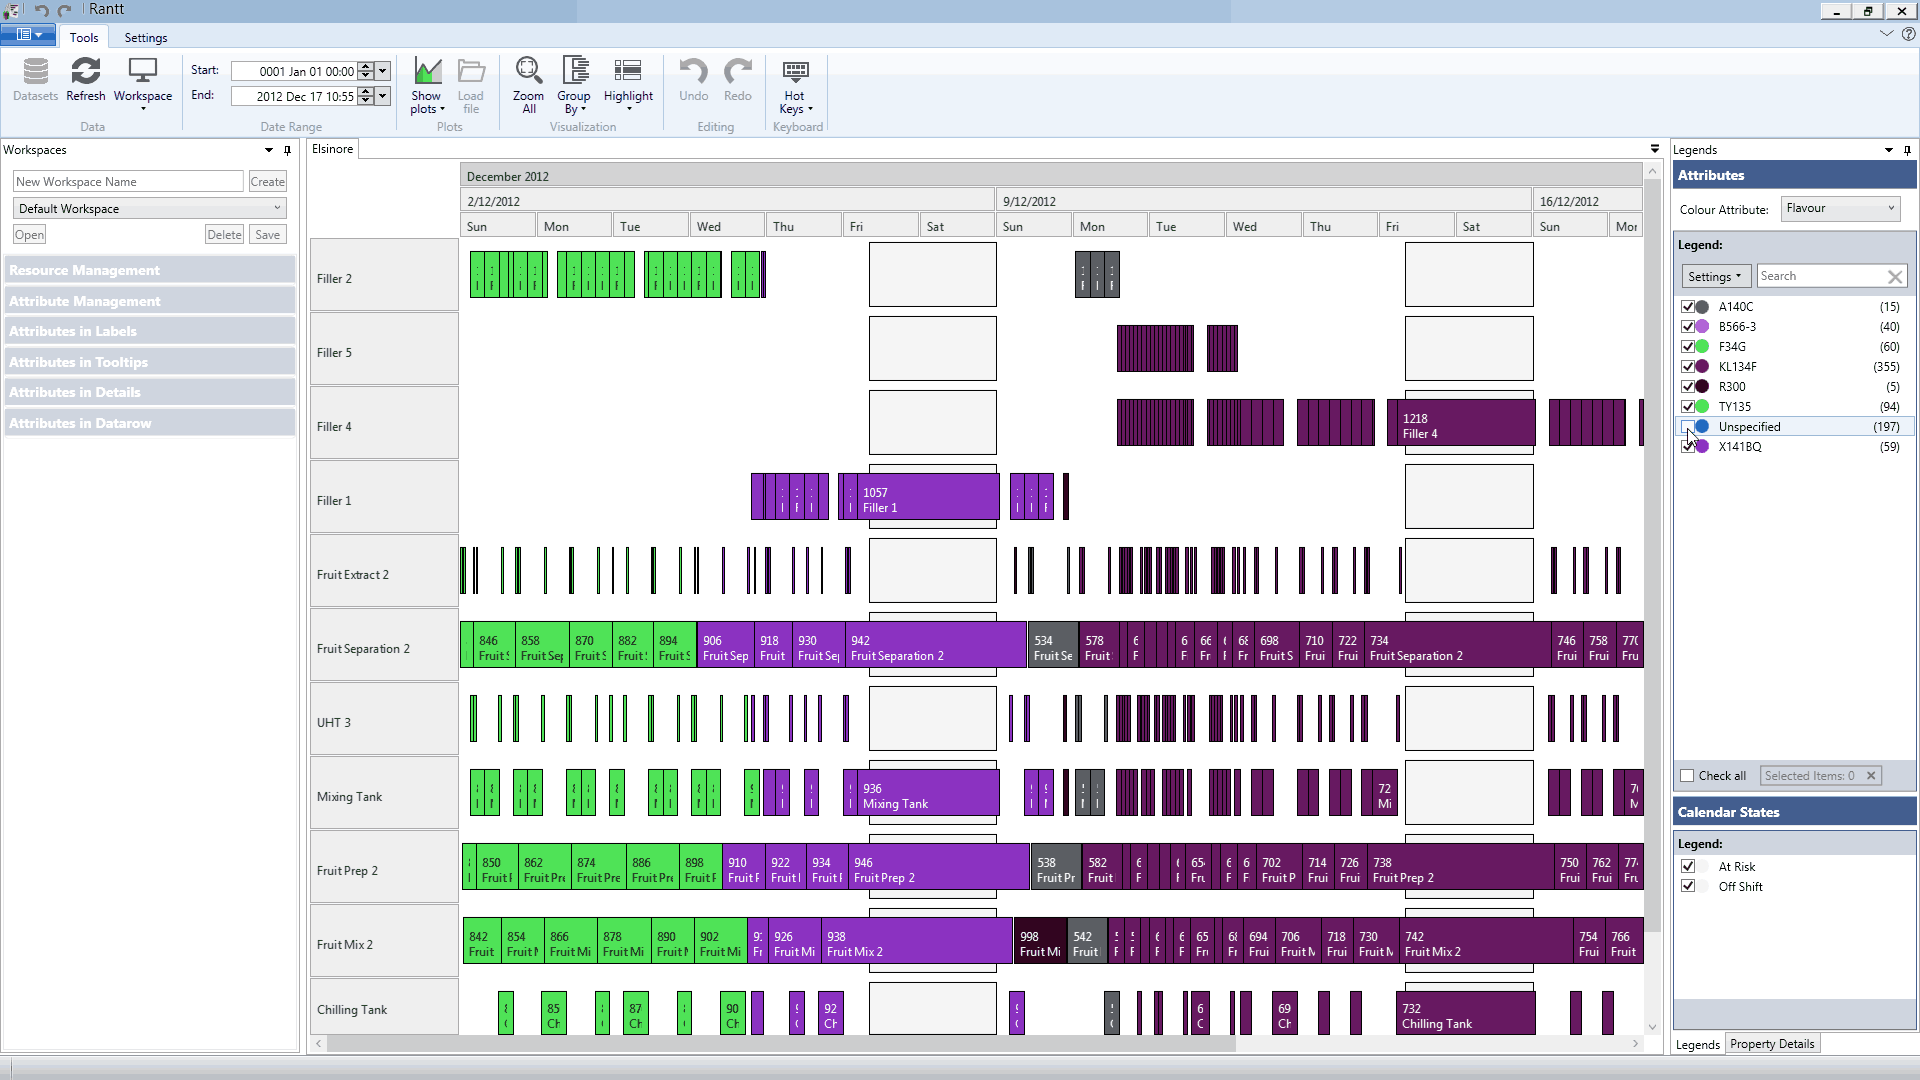
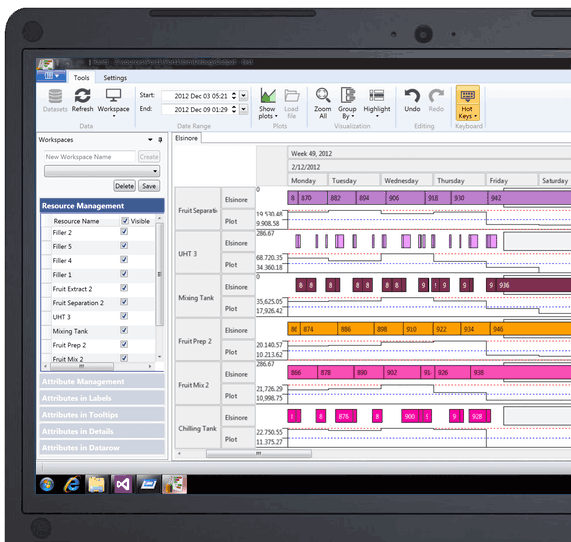
The key thing with analysing time stamped data is being able to understand the time relationships between events (or tasks/operations).
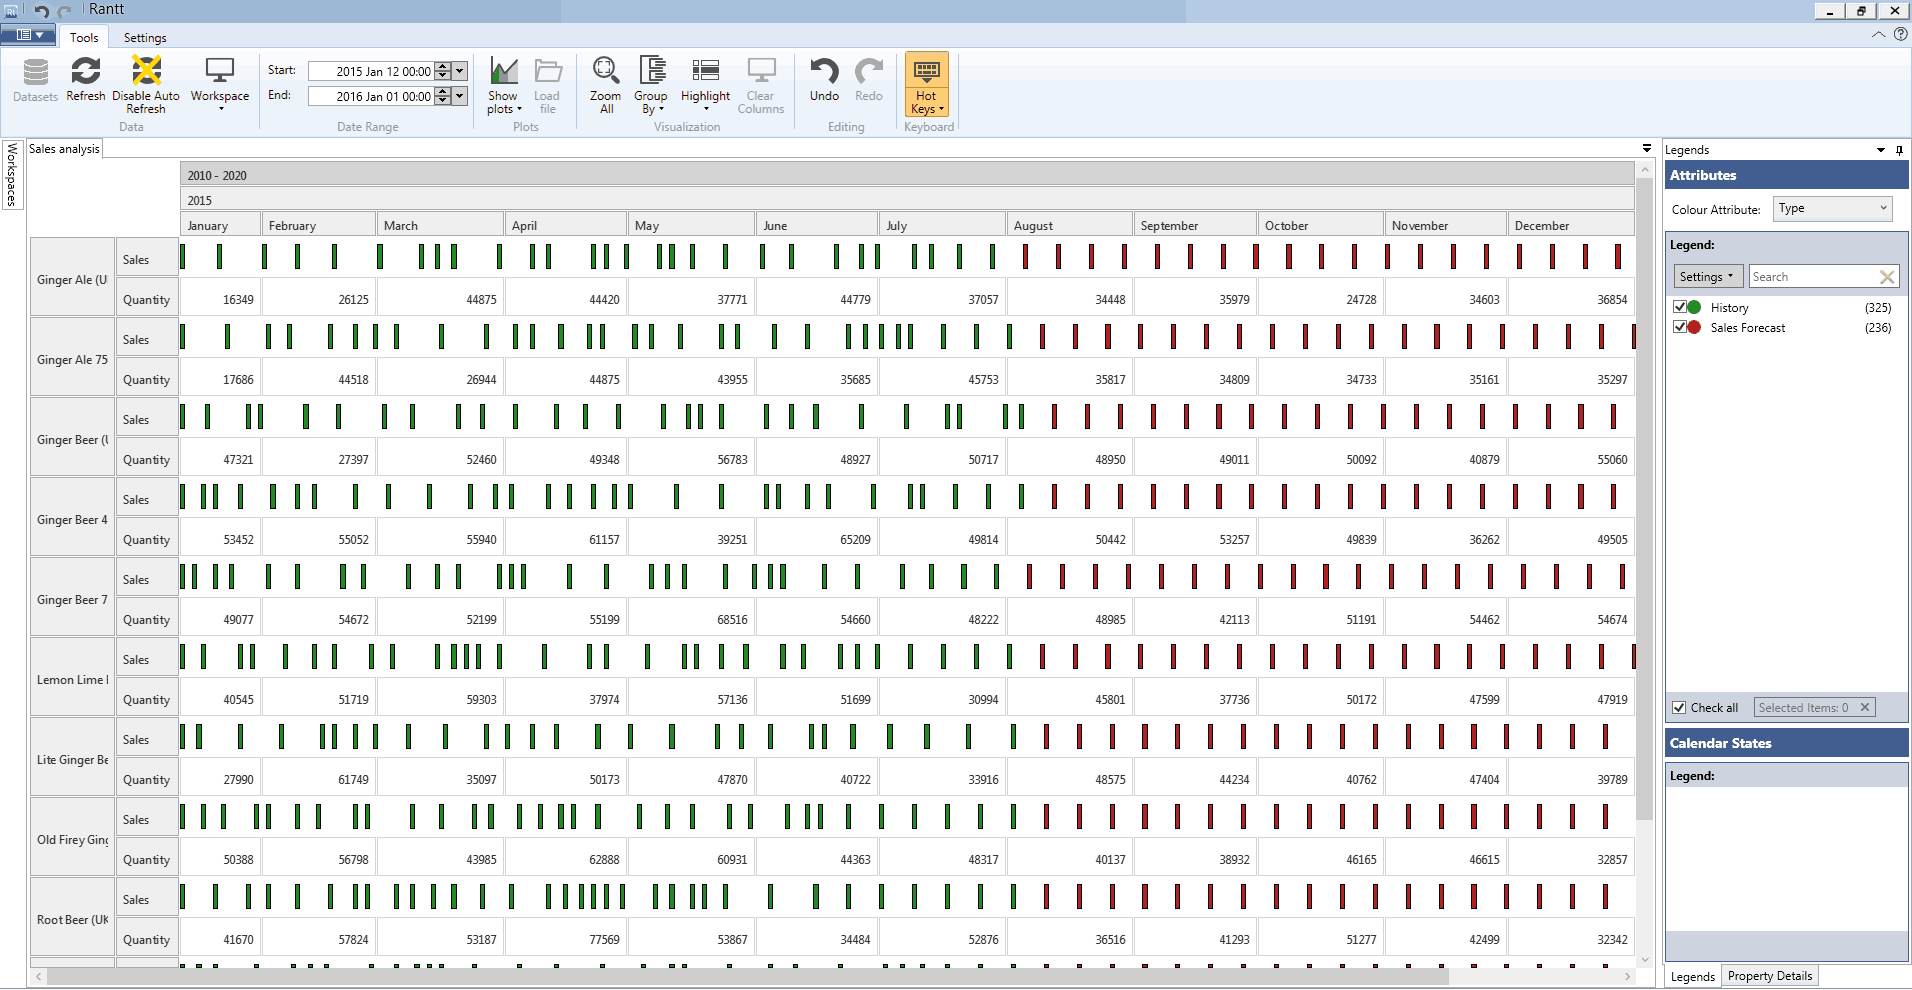
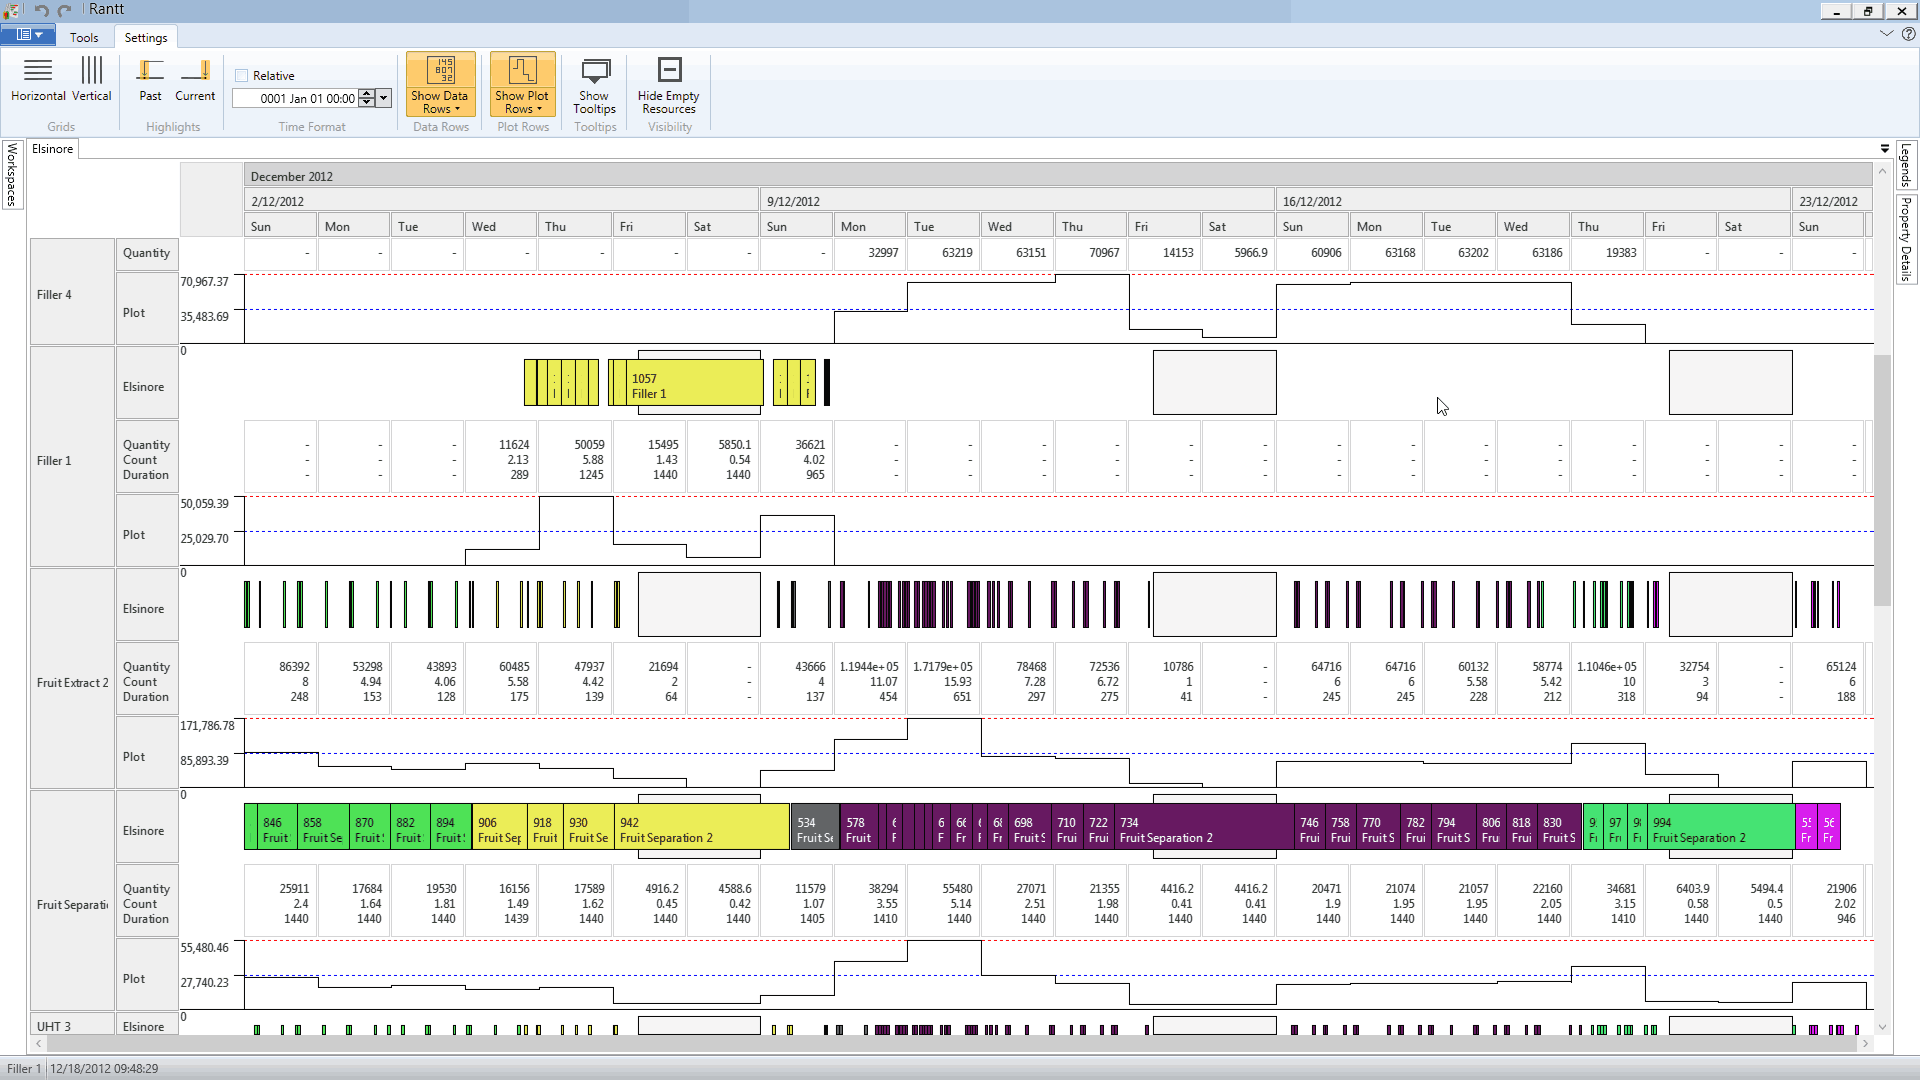
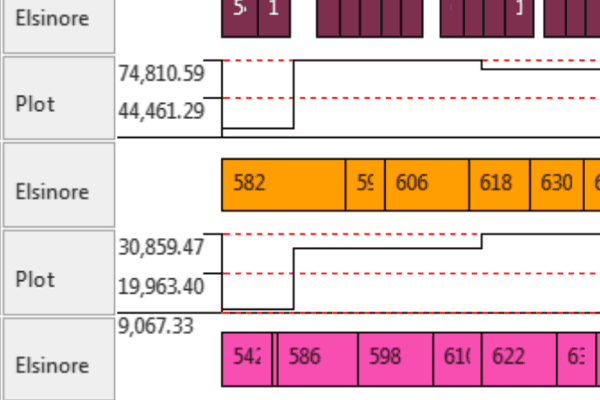
Viewing time stamped data in a grid gives you a feel for the values. Rantt takes understanding time stamped data to a whole new level by showing you the temporal nature of the data.
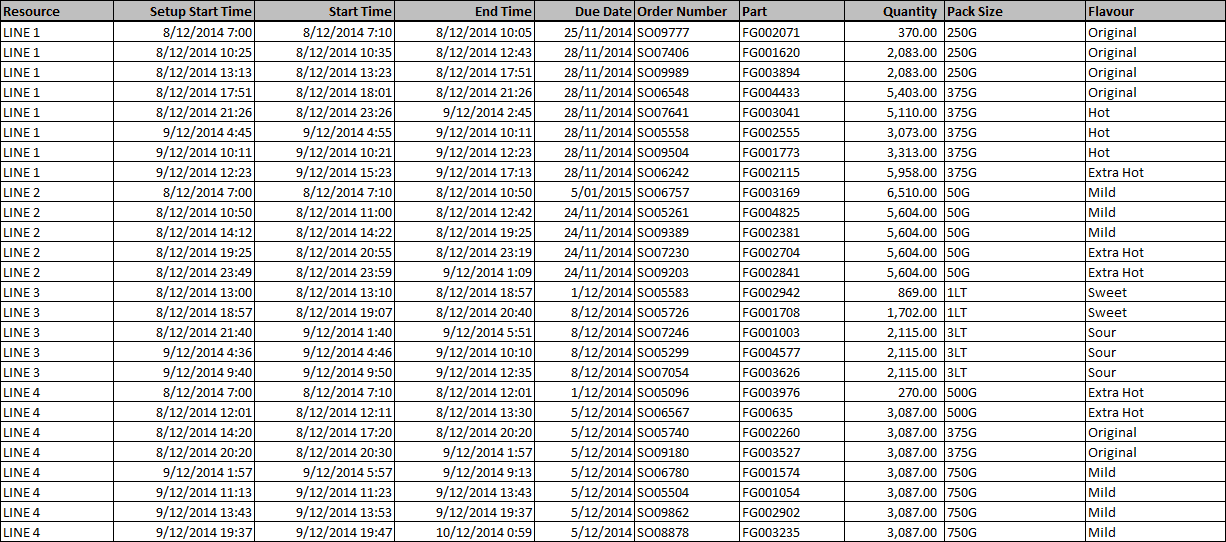
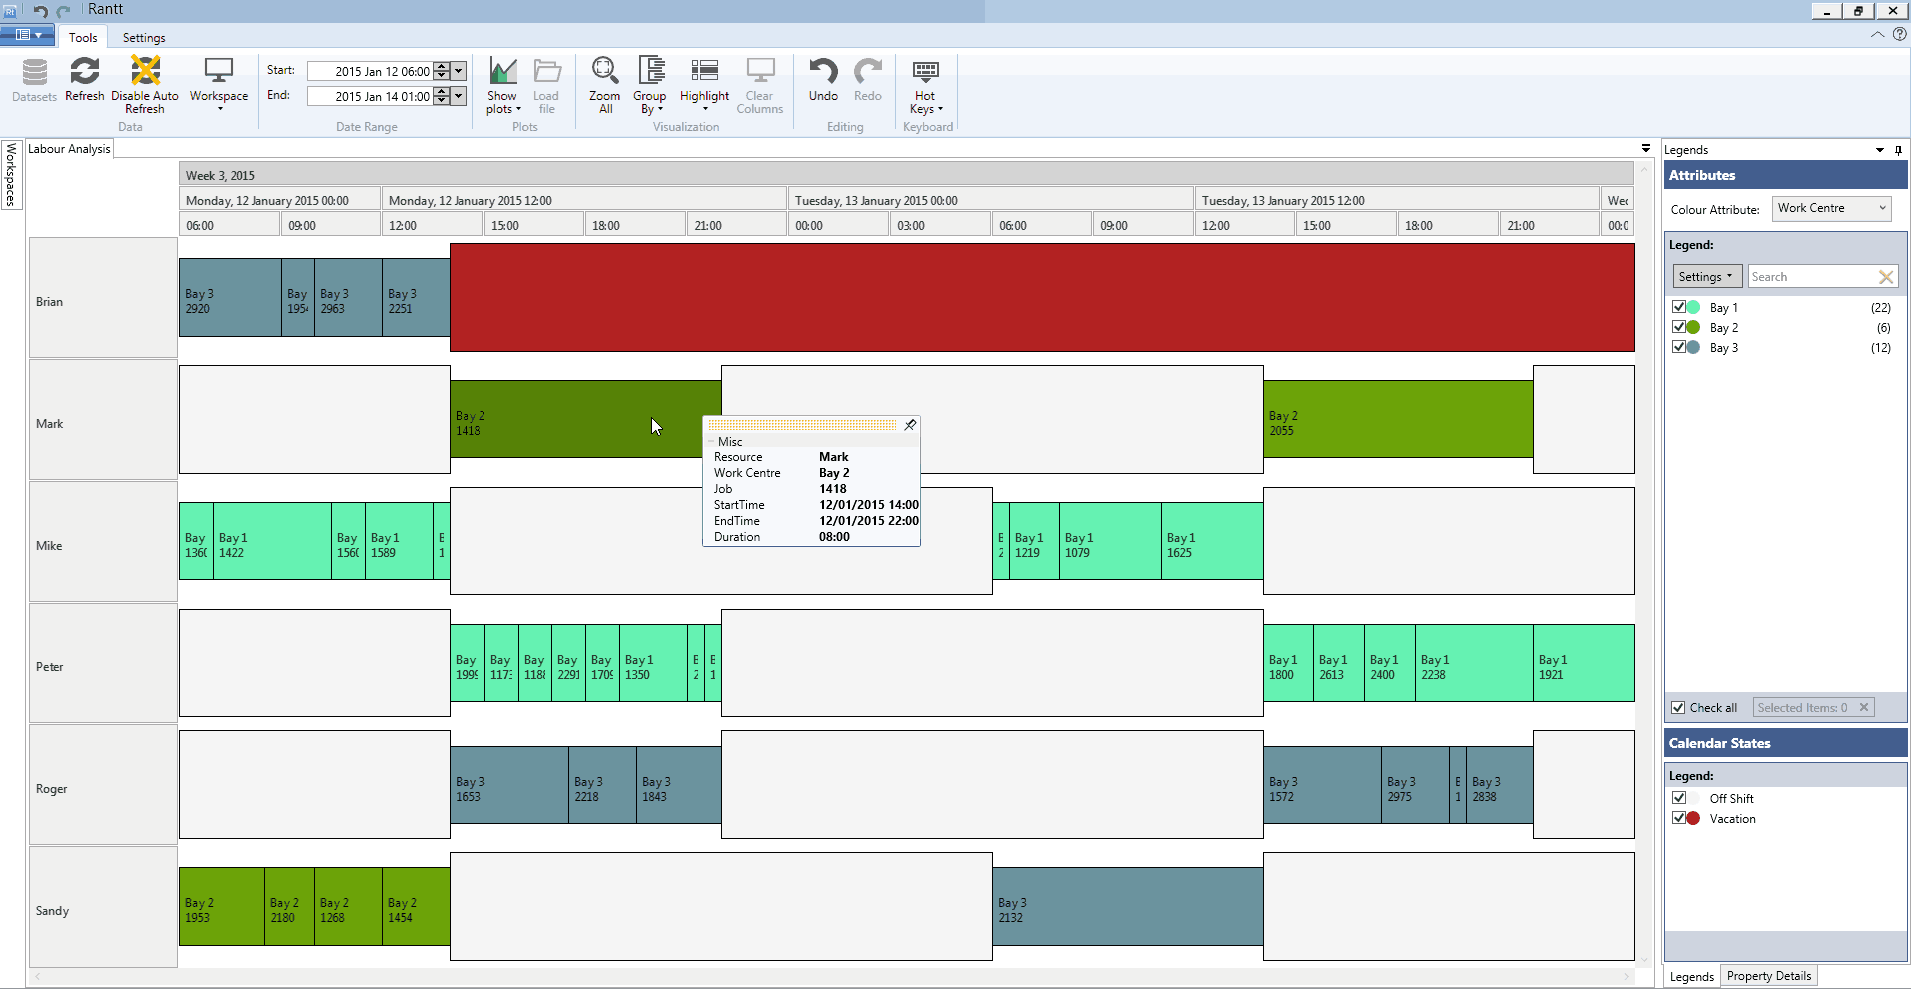
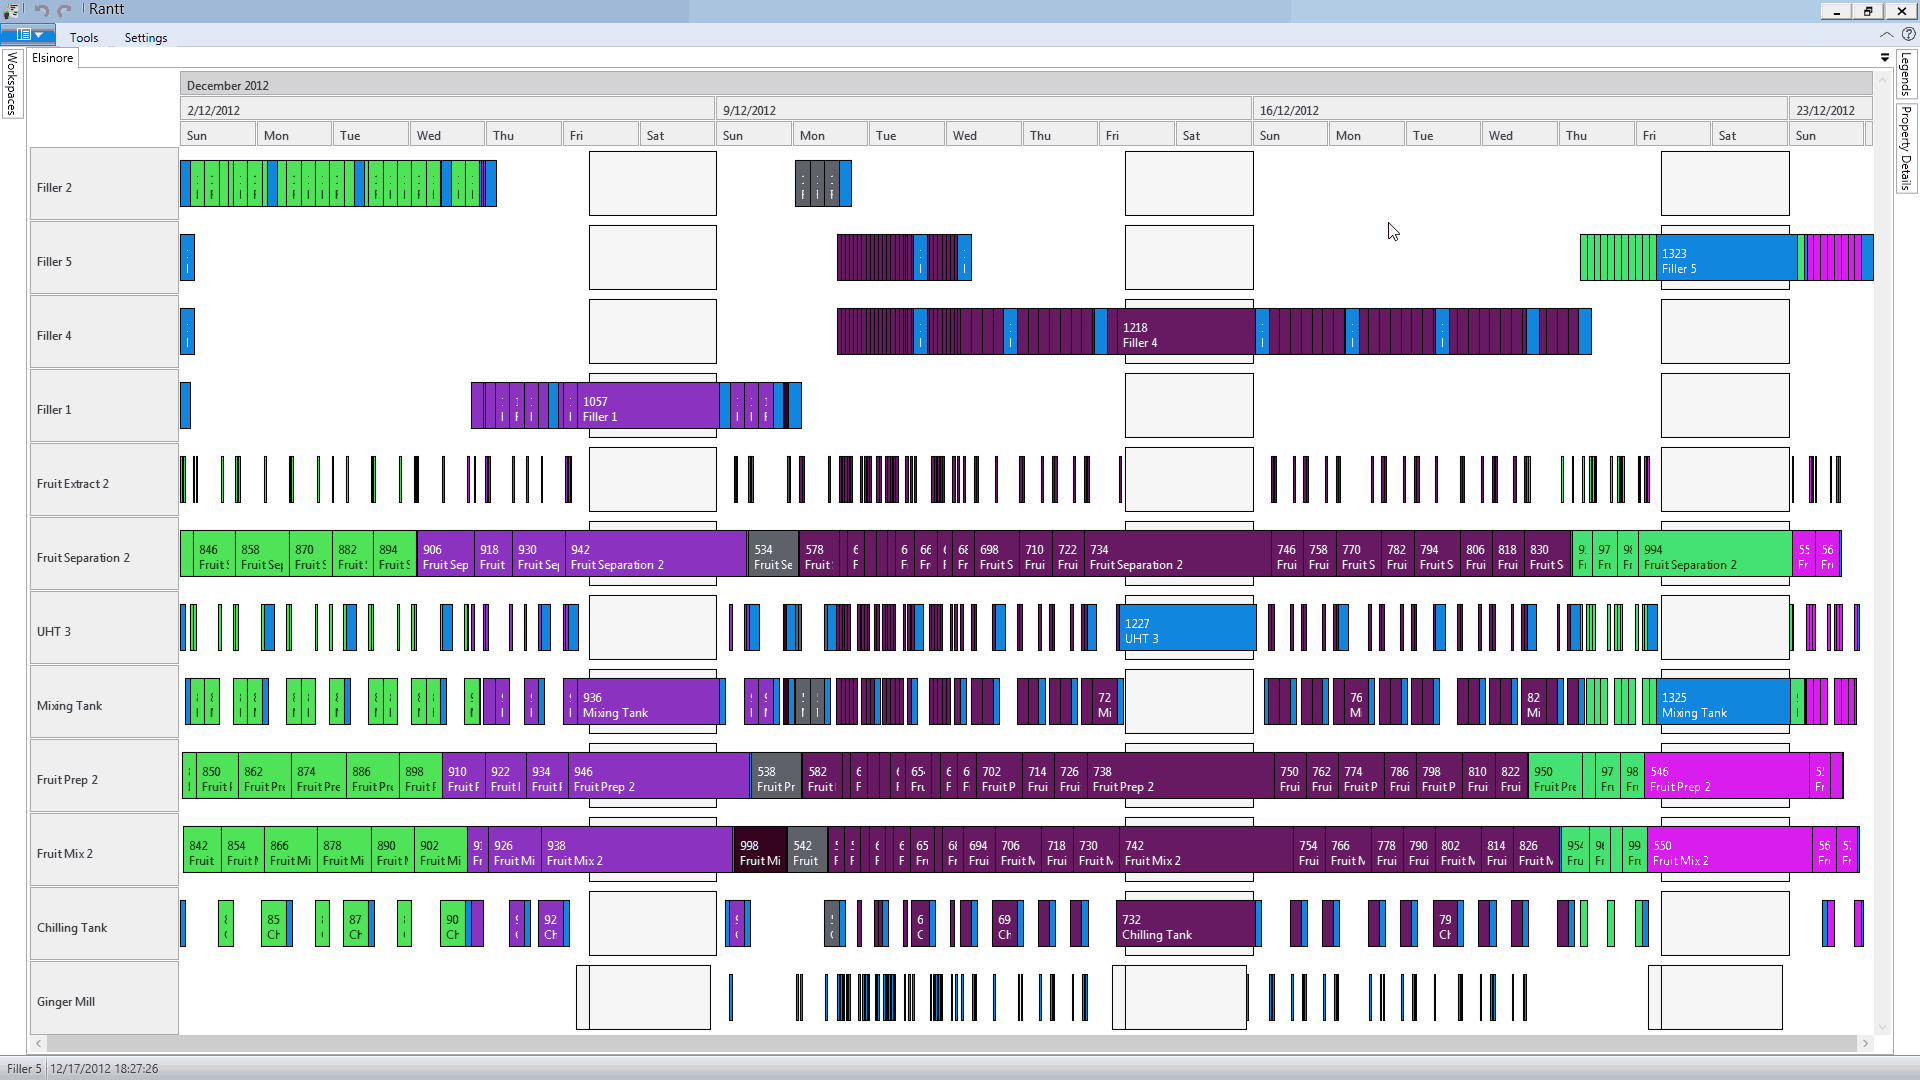
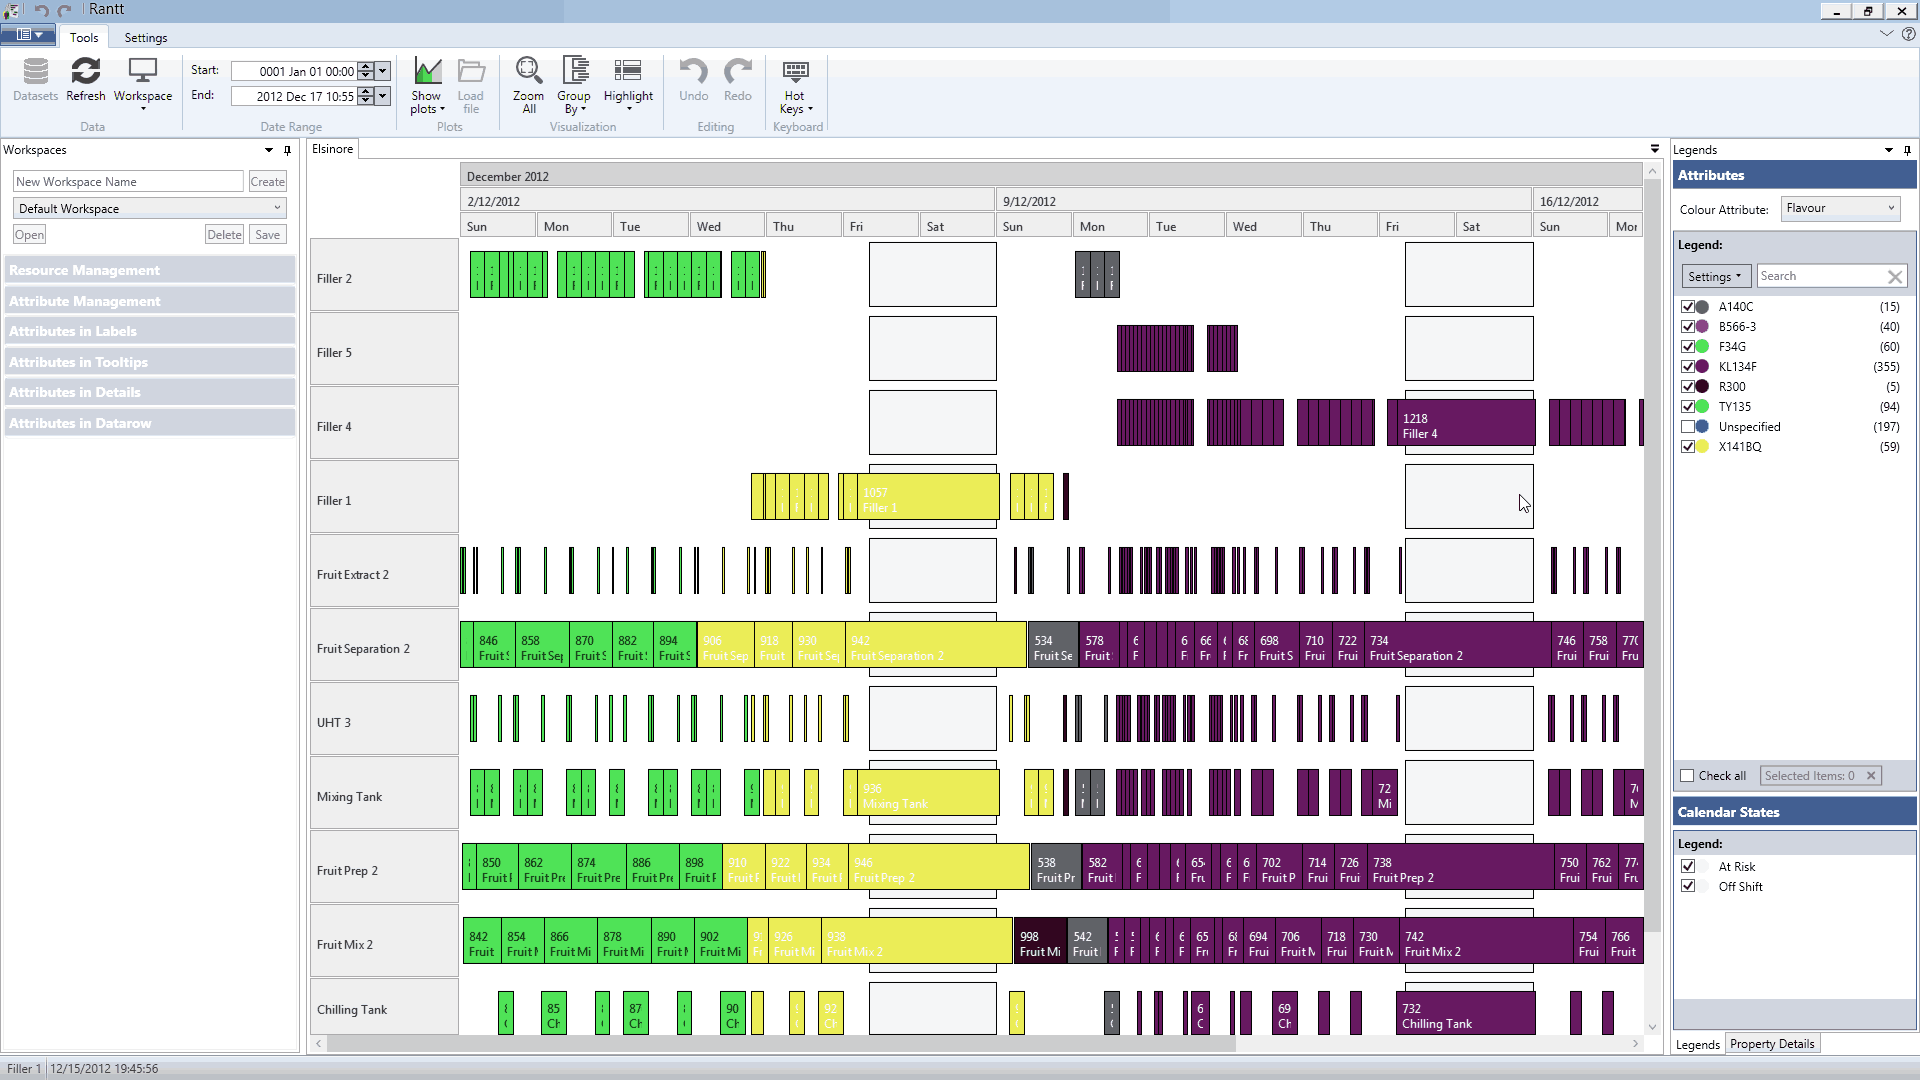
To understand the power of visualising time stamped data, from the production schedule in the data grid below try to answer these questions:
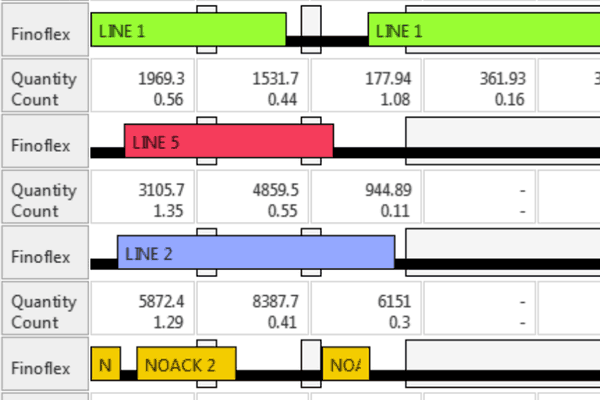
- How much of the time are the lines/resources idle?
- Is idle time available for production at the end of the schedule or is it spread throughout the week where it’s hard to take advantage of?
- Is the load balanced across several lines/resources?
- How much of the time is lost due to setup?
- Are similar products grouped together to minimise setups?
- Are there any errors in the data like overlapping events on the same line/resource?
- Does the schedule “look” right?
- Are events planned at the right time?
- Do events have the right duration?
- Do events occur in the right sequence?
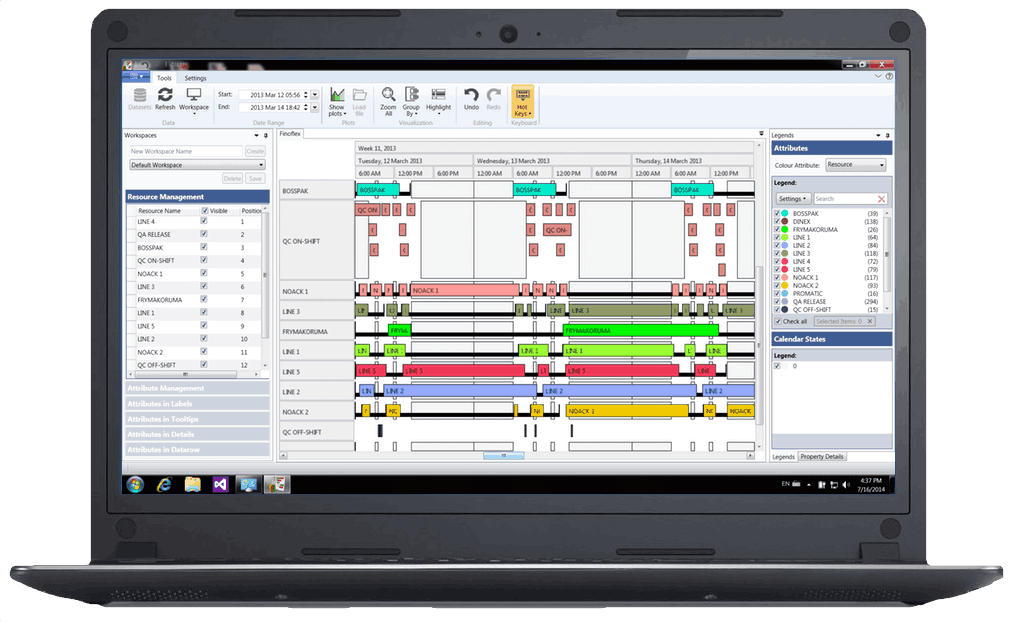
Rantt has been designed to
- Be easy to use
- Be fast (Navigate through large amounts of data quickly)
- Connect to multiple data sources such as csv files, Excel spreadsheets or database tables
- Navigate large datasets
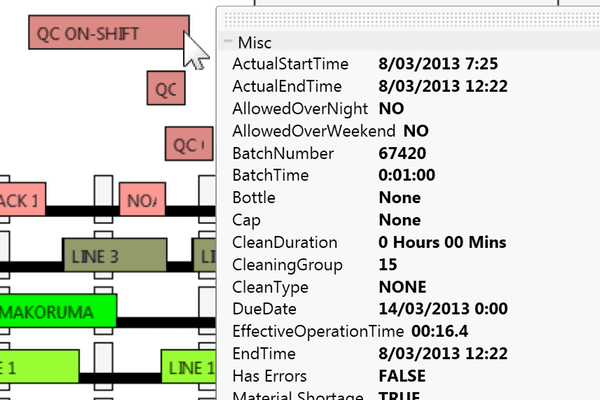
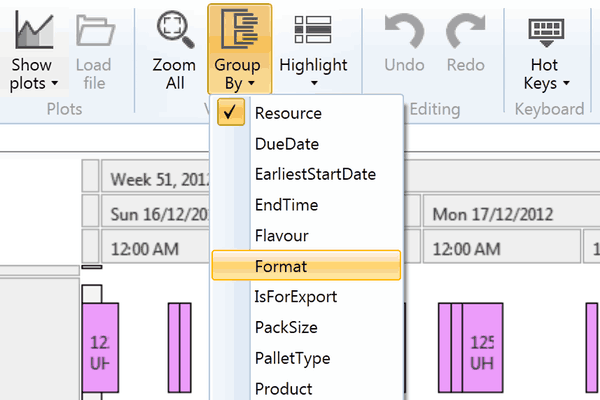
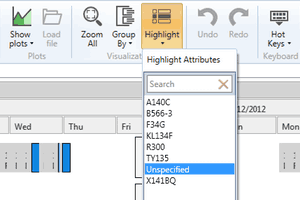
- Be highly configurable
- Empower end users to quickly find the information that matters most to them