Documentation
Workspace Settings
A workspace allows you to:
- Configure the Gantt chart exactly the way you want it to look.
- Store all your settings under a convenient name.
- Switch settings quickly and easily.
Once a workspace is saved you can easily switch between different workspaces you have created. When you select a workspace from the drop down box, all the settings for the workspace will be restored.
For examople you can store the following settings in a worksapce:
- Hide some resource
- The order in which the resources are displayed
- The labels that are shown in an operation
- The order in which the labels are displayed in an operation
- The content in the tooltips
- The order in which the content is displayed in the tooltips
- Grouping tooltip categories
- The default legend control attribute
- Enable or disable data rows, or plot rows
- Enable or disable tooltips
- etc…
Nearly every cusomisable setting can be saved in a workspace and restored at will. Different workspaces can be associated with different scenarios, or focus on different aspects of the data. Being able to switch between workspaces quickly and easily will allow you to get he most information out of your data quickly.
Create a workspace
To create a new workspace:
- Enter a name in the text box and click on the create button.
- Make the changes you require on the Gantt chart.
- Click the save button.
New settings can be added to an existing workspace by clicking on the save button at any time.
Note:
Please note all settings described on this page are optional.
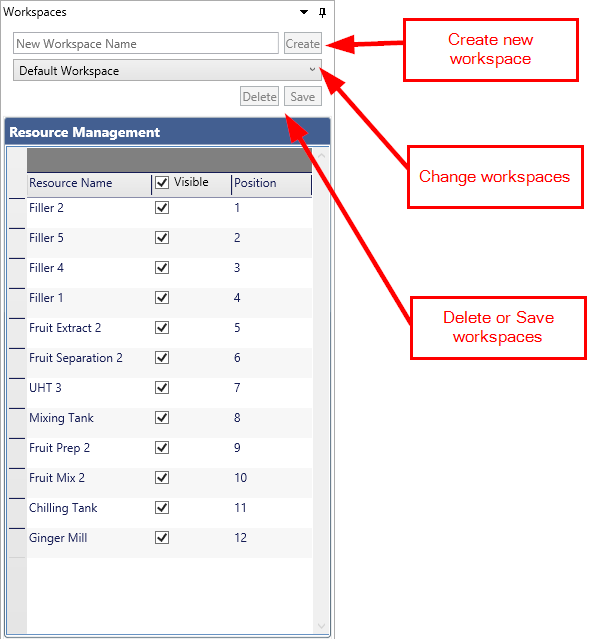
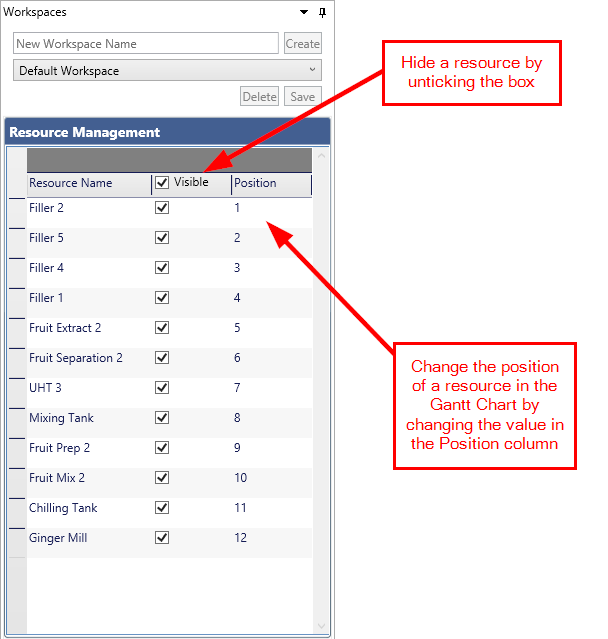
Resources Management
- Show or hide a resource from the Gantt chart by ticking or unticking the check boxes.
- Change the position of a resource in the Gantt chart by double clicking on the position cell and changing the value.
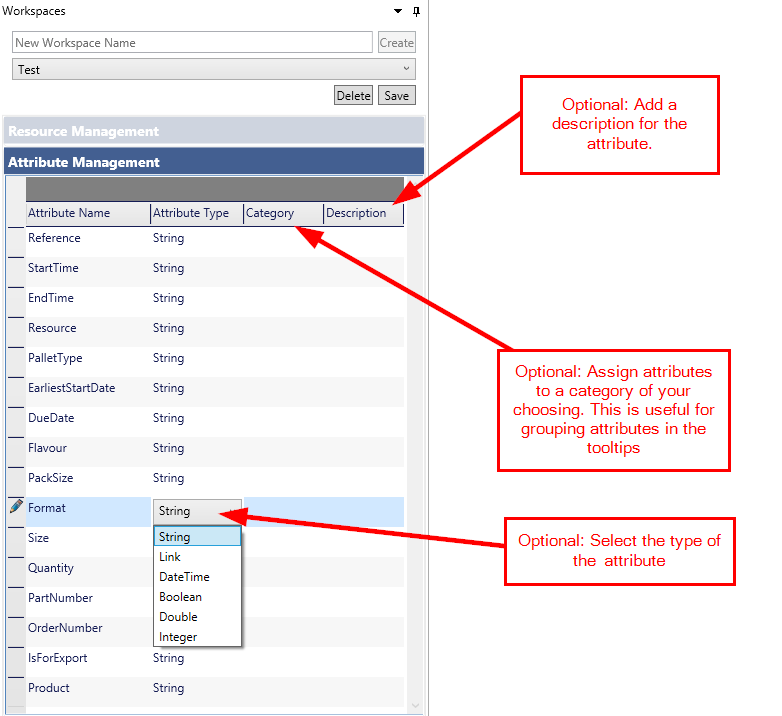
Attribute Management
- Change the type of an attribute. The various types are:
- String
- Link
- DateTime
- Boolean
- Double
- Integer
- Assign the attribute to a category. Attributes with the same category will be grouped together in the tooltips.
- Add a description to the attributes.
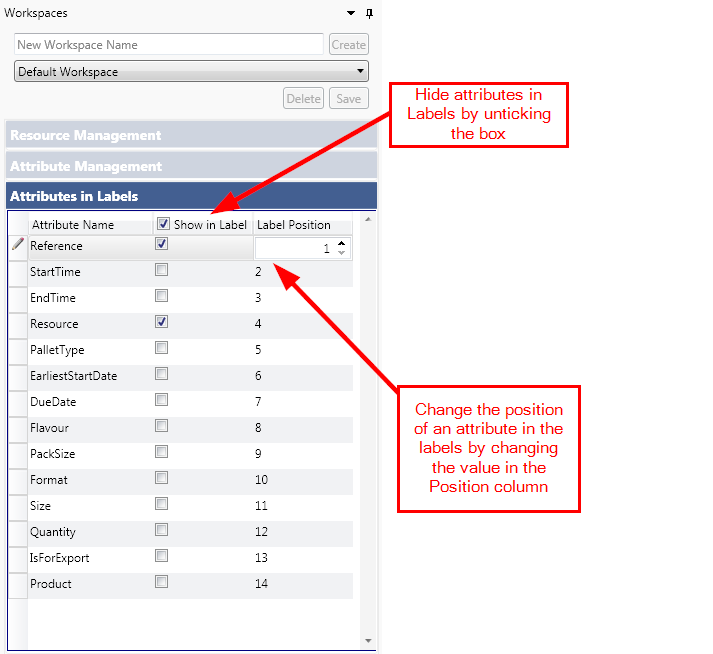
Attributes in Labels
- Show or hide attributes in Labels, by ticking or unticking the check boxes.
- Change the position of each attribute in the labels by double clicking on the position cell and changing the value.
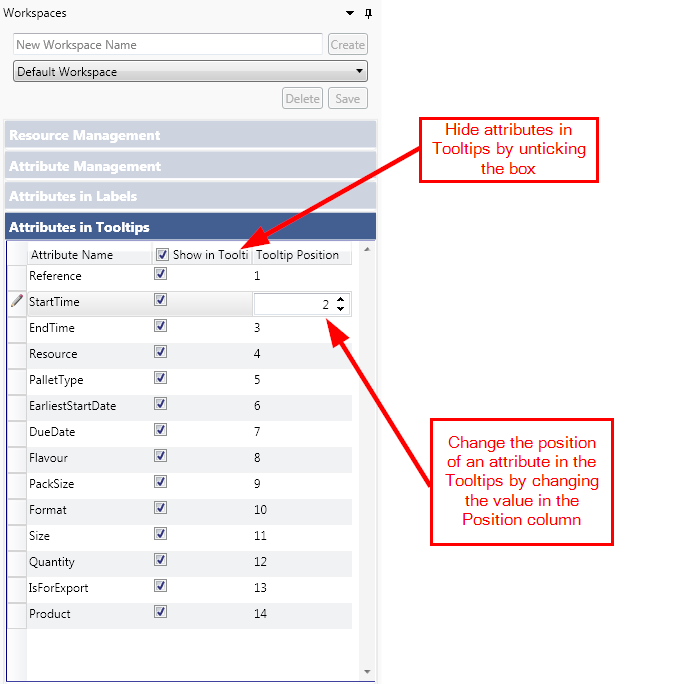
Attributes in Tooltips
The Attributes in Tooltips panel allows you to:
- Show / hide tooltips on the Gantt Chart, by toggling the check boxes.
- Change the position of each tooltip on Gantt Chart by double clicking on the position cell and changing the value.
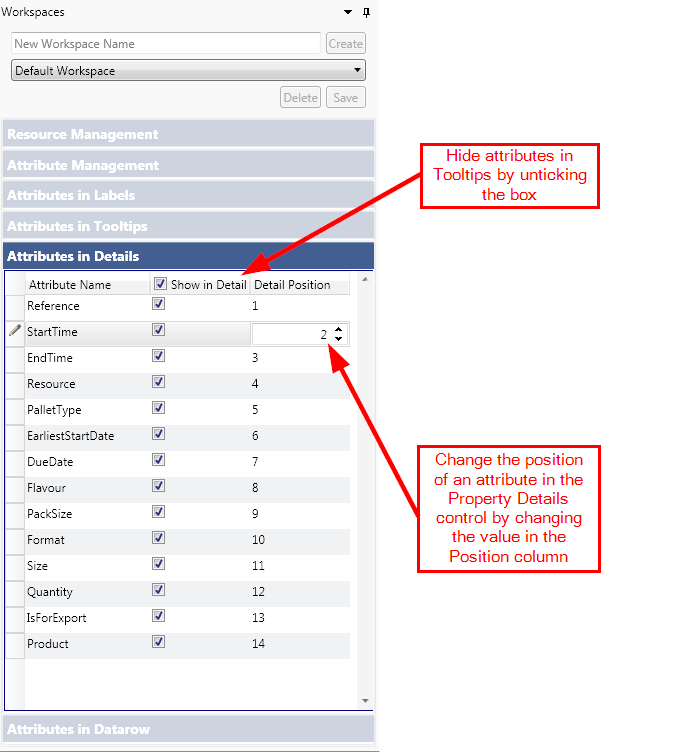
Attributes in Details
- Show or hide details on the Property Details control, by ticking or unticking the check boxes.
- Change the position of each detail on the Property Details Control by double clicking on the position cell and changing the value.
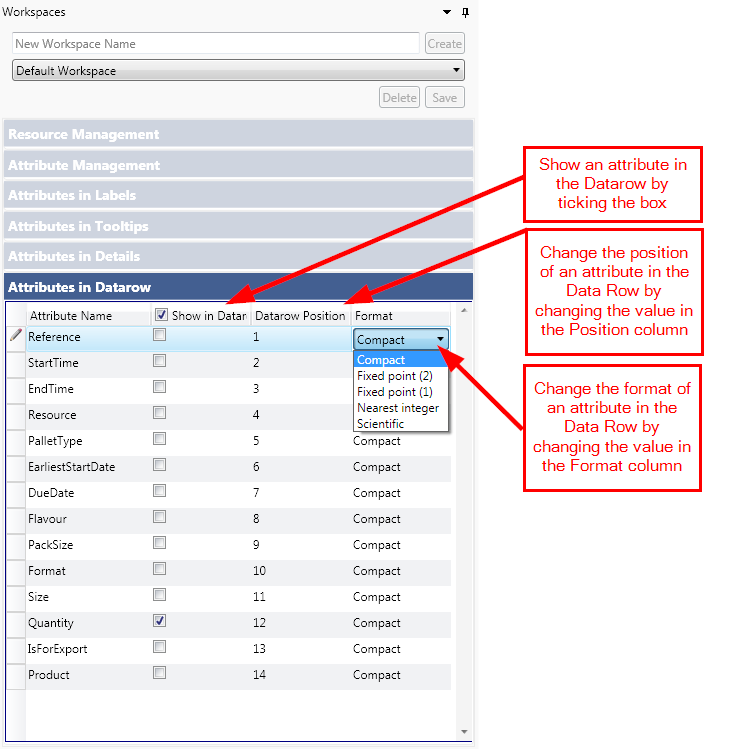
Attributes in Datarow
- Show or hide the attribute from the Data Row, by ticking or unticking the check boxes.
- Change the position of each datarow on the Gantt Chart by double clicking on the position cell and changing the value.
- Change the format of datarow by double clicking on Format cell and selecting the appropriate format.
The various formats for a number like 12345.678 are:
- Compact: 12346
- Fixed point(2): 12345.68
- Fixed point(1): 12345.7
- Nearest integer: 12346
- Scientific: 1.2E+04
Note:
In order for an attribute to be displayed in the DataRow, it needs to be a numeric type, otherwise the value displayed will be 0.